Regression is a statistical method of predicting the dependent variable given independent variables. Dependent variables are the variables that the researcher has no control over where else the independent variables are the variables that the researcher has control over. This method is usually supervised. In a Multiple regression method the number of Independent variables are more than one. There are many types of regression which includes: Linear regression, Logistic regression, Polynomial regression, Support vector regression and decision tree regression.
Data scientists and statisticians use different kinds of machine learning algorithms in order to discover patterns in the data. Algorithms can be classified into either supervised or unsupervised two depending on how they learn to make some prediction. In supervised machine learning you have to input the independent variable in order to get the predicted value. In this case you use an algorithm to map the independent variable with the dependent variable.
Methods for supervised Machine learning algorithms include: Logistic regression, Linear regression, Decision trees, Support vector machines and multi-class classification. Supervised learning can be classified further into regression and classification problems (Huang 2011). The difference between classification and regression model is that classification problem is that the dependent variable is numerical in regression and categorical for classification. Regression is suitable only when the output is a continuous or a real variable such as weight, age or salary.
Classification predictive model requires that examples be classified into two or more classes. It’s mostly used to classify labels. In the banking sector credit card fraud is a major setback in the banking industry. We can use logistic regression to predict whether a given transaction is fraudulent or not using past data like amount, date, place of birth.
Let’s say you have the following training data set of football players that includes “color jersey” they have, which position they play, and whether or not they are injured. The training set is marked according to whether or not a player will be able to play for Team B.
| Person | Jersey Color | Offense or Defense | Injured? | Will they play for Team A? |
| John | Blue | Offense | No | Yes |
| Steve | Red | Offense | No | No |
| Sarah | Blue | Defense | No | Yes |
| Rachel | Blue | Offense | Yes | No |
| Richard | Red | Defense | No | No |
| Alex | Red | Defense | Yes | No |
| Lauren | Blue | Offense | No | Yes |
| Carol | Blue | Defense | No | Yes |
What is the rule for whether or not a player may play for Team B?
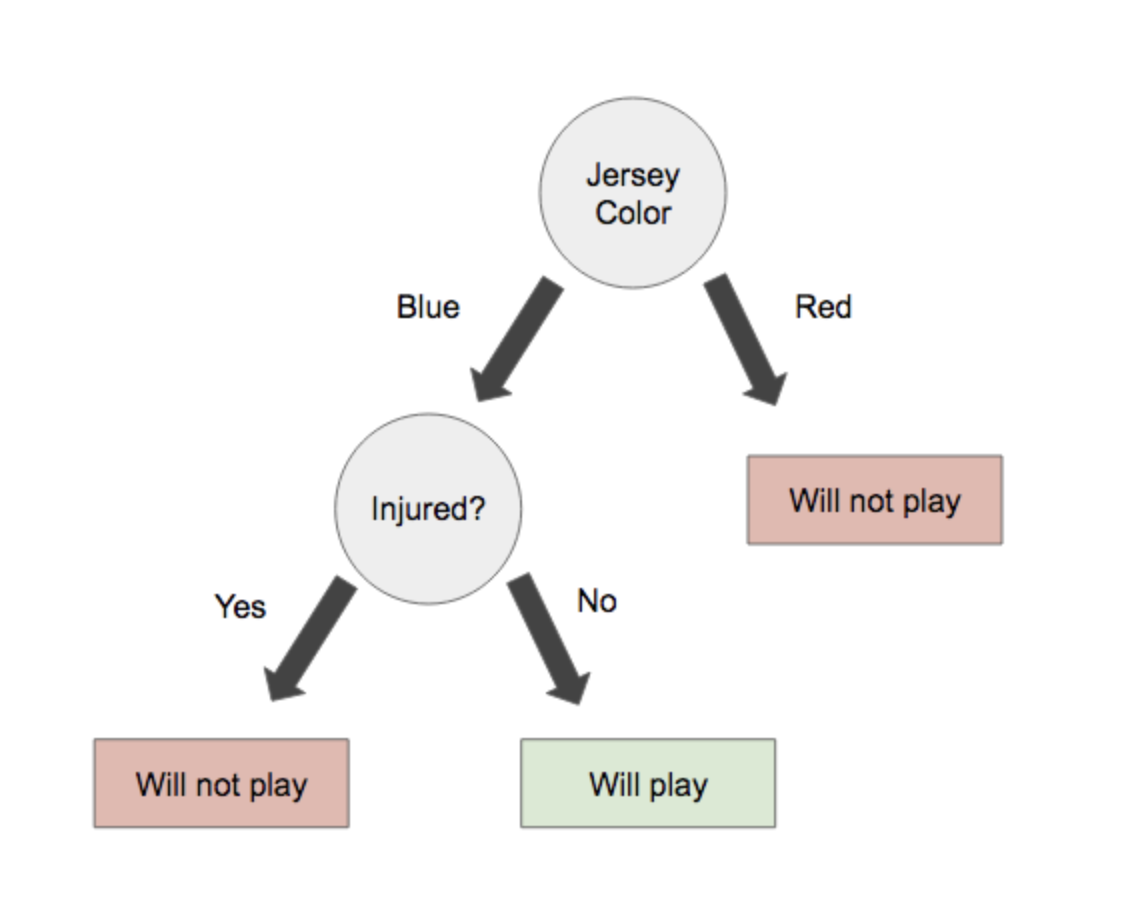
In this example we are going to use the decision tree to classify this data.
select a rule to start the tree.
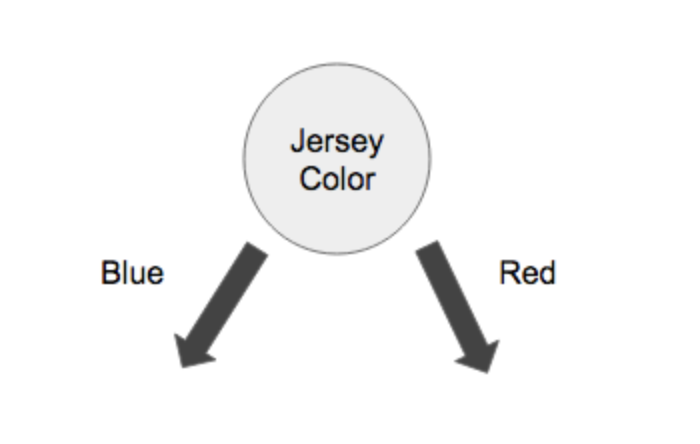
Here we will use “jersey color” as the root node.

Then, we will include a node that will differentiate between injured players and uninjured players.

Application of Logistic regression is commonly used in the health sector. For instance, in analysis the determinants of hypertension the following is an assumed model for predicting hypertension.
Ln(ODDS) = 4.535-0.983(Heart Disease) + 0.007(glucose level) + 0.048(Body mass index) – 0.916(Smoking status1) + 1.81(Smoking status2) + 0.06(Smoking status3)
In order to determine factors that influence hypertension we need to use logistic regression. Several factors such as glucose level, body mass index, heart disease and smoking can be used to explain the likelihood of being diagnosed with hypertension. The analysis checks each factor separately and establishes its impact on the chances of getting hypertension. For instance, when analyzing the body mass index, the model explains how increasing the body mass index by a single unit increases the likelihood of having hypertension. The analysis of binary logistic applies the concept of odds which explains the likelihood of an occurrence.
Probability concentrates on occurrence of future events where else in likelihood you have observed an outcome and you want to find the probability distribution of the event.
References
Huang, G. B., Wang, D. H., & Lan, Y. (2011). Extreme learning machines: a survey. International journal of machine learning and cybernetics, 2(2), 107-122.
Source
This machine learning homework sample was willingly provided by https://myassignmentlab.com, an expert assignment service whose experts help students with doing homework projects in STEM disciplines such as programming, math, physics, chemistry etc.
